Search This Blog

Wednesday, February 19, 2014

When did the Bull Market start?

Kids, the charts below will show you the turmoil of the years. Enjoy the notes attached to each.


1st Half 2011


2nd Half 2011


1st Half 2012


2nd Half 2012


1st Half 2013


2nd Half 2013


As you can see from the above, fear and greed can cause enormous swings daily. We often forget how dfficult riding a bull market and navigating the moves actually are. History is kind to an overall trend, after all. There is no way of playing every nuance in a market at any given time.

For me, the Bull Market started in October 2011, the reasons for which are apparent with the notes. The market in October 2011 became a discounting mechanism for the fist time since 2007. Healthy markets are always primed with a dose of skepticism which allows for upside suprises at a time in the future. This is as precisely what I was noting during the summer of 2011 into the October. A broken market which was not discounting, morphing to a healthy market that was. Do not get drawn in by those that suggest the bull market started in March 2009, the price of SPX just bottomed then. If you manage to speak to some veterans of the 70's and 80's they will happily remind you that just because price bottomed, it did not necessarily mean the start of the bull market was at the same time.

The detail on the above charts are noted purely because I cant hold all the minutae and I needed a few reminders along the road.

As it pertains to remembering dates, remember Mum's b'day, it's important!!!

Queen takes Pawn


Thursday, February 13, 2014

What does a growth scare look like?

Kids, it's not all bad, no matter what others say.

There are times that stock markets will react in ways you were not expecting. There are other times when they react exactly how you expect! What does that prove though? It proves that the stock market is almost a living and breathing creature. It is a reflection of all participants thought in one place at any onetime. The right, the wrong, the informed, the not so well informed. What you will try to do is be more informed than most, that way you try to stack the cards in your favour.

You can see such moves in the early part of 2014.

When the Fed finally moved in December, the ramifications were pretty clear, things change. The issue is, what things?  It was Emerging Markets last week. Anything with Emerging Market exposure at some point last week had a bad time. Then, some poor data from the US had people fighting over how bad a growth scare would be.

Let's look at growth scares. They come in all forms, they can be triggered by any piece of data at any time. However, not all growth scares are created equal. The nastiest US growth scares usually start from the bond market. When bond yields rise too fast, there is every reason to sit up quickly and take notice. The trouble with yields moving higher quickly is all about positioning, that is mortgages, convexity, hedging instruments and how people can get offside too fast. When people say something as bland as "too far too fast", it means something in bond land!

Do not ever underestimate the power of the bond market during these times, they rule.

What about other growth scares triggered by events we couldn't even think about? They are all navigable using the panic days that have been discussed in earlier posts. You just have to keep your head while all around are losing theirs. You will be pleasantly suprised at the benefits of buying panic in a bull market.

There will always be panic, there will always be someone trying to convince you this is 1929, 1974, 1987 or 2008-9 all over again. Those events are extremely rare and shouldn't be counted upon to repeat regularly.

Do not ever get upset that a growth scare threw you from a bull market, that is precisely what they are intended to do, you will sell what you love, buy it back higher and kick yourself for being so trigger happy. You should, it's a great learning experience, it has happened to me more often than I can tell you or care to admit.

Try to understand the cycles that you are in, they are remarkable. They are repeatable and very rewarding.

Over time, you will trust your instincts more than the musings of lightweight reporting and young inexperienced professionals. With some luck, you will recognize the genius that actually is the stock market itself and the language that it speaks, it's a journey of ambition as much as anything else. Keep a level head and clear vision, they will serve you when the growth scares are encountered.

Always strive to learn from these episodes, keep your balance, understand the emotions. It's the same as your skiing, fear is there to learn from. You have mastered some lessons already. Mum and I continue to be amazed at your progress.....

Queen takes Pawn


Thursday, January 16, 2014

What do you know about cycles? Are they predictable?

Kids, that's a great question and one that is often overlooked....

If there is one thing that is certain in the world, it is that cycles are inevitable. Not every cycle looks the same, not every cycle is as predictable as the last one. Human behaviour is the underlying cause for cycles, of that I have no doubt.....

The best historical evidence of cycles are the Empires. Greek, Roman, Ottoman, Persian, British to name just a few. They are littered with similar facts and waves of success and in all cases, decline. There were significantly different reasons why the Empires came about. The British Empire was one of Naval warfare and success. The Romans won on land and Sea (Europe/Meditteranean/Egypt), the Greeks on the Ocean (but locally), you get the point. Learning from these cycles is of the utmost importance to understand the potential pitfalls of the future.

The most recent cycle for the US had the hallmarks of 1907 with a very similar financial crisis. If you want to read a quick book about it click the link. Was it predictable? If you were looking in the right place it was. I looked at the yield curve, it helped me, not others (human behaviour at its' finest). Some people looked at the source of financial leverage and could see a serious issue. The annecdote that stands out, that I couldnt understand completely, was how everyone was renovating their kitchens for gigantic sums of money, surely that couldnt be right. As it turned out, it wasn't.


Yield curve chart
FRED Graph

The chart above is a picture perfect cycle chart, peaks and troughs.....wonderful.

Consumer Confidence

Graph of University of Michigan: Consumer Sentiment

As you can see from consumer confidence, the peaks and troughs are gigantic.They are not quite as priceless as the yield curve, but it does show human nature through good and bad times. This can also be seen in Wages below.


|
There are also cycles within cycles. This is best seen with stock markets and stock market behaviour. Below are the conditions that I like to note.....

Phase I:
Early cycle sectors include: Transports, Semis, Finance, Retail (there are others). I class this part of a bull market as PHASE I
This phase has been well discussed and documented, it is the predictive phase without solid evidence that it will happen. The rising tide has a habit of raising all boats. Consumers become more confident, spending habits start to return and populations start to finally see some benefits of better economic news in jobs. The moves are violent, sometimes eye-watering. If the market is discounting future bad news, you know you are on the right side. SPX likely outpaces Russel 2000.

Phase II:
The next phase becomes quite tricky to predict and navigate. Phase II sees spending habits return to a cyclical pattern. Spend some money at christmas, pay off the credit card in January through March. You also see some bigger ticket items being bought at the expense of other discretionary purchases. For instance, if you need a new car, you will source the money from the same pot of money, but it means you wont necessarily spend on a new garage door. Buying a house, sure, but leave some of the interior decorations for another time, including the new dining set! Again, you get the point. Wallet size starts to grow, but previous experience dictates you don't want to overstretch. At this point breakouts are the only serious playable idea. New highs are rewarding. Companies that disappoint will not reward capital. Russel 2000 likely outpaces SPX

Phase III:The real fun is Phase III. The shackles now come off. You can see behaviour change dramatically, spending habits change dramatically. New kitchens are the norm (2007). Buying Internet stocks on monday to sell on friday to finance a boat on saturday (1999). Clamouring for Conglomerates (1987) becomes the dinner party conversation. There are sizeable wins to be had from such behaviour with equivalent pitfalls to avoid at the same time. Do not be afraid to enjoy these times, they are fun, but it's time to be a little more prudent as you were successful in Phase I and II. Chaos trading as Russel 2000 will likely outpace SPX to start then turn tail as growth prospects start diminishing.
The illustration below is an excellent representation of the above from Fidelity....


Typical Business Cycle


The most interesting part of cycles is you dont have to be an expert to see them. If you look around and take the temperature of behaviour, there is every chance that your experiences are just as good as reading from a text-book or listening to an "expert". There are plenty of "Cycle Theories" ranging from Kondratieff, Fractals, Cyclical, Secular, 17.6year cycle, Elliot Wave, Fibonacci to name just a few. All have their merits and followers, most will work when back-tested and with hindsight! Be warned, there isn't a magic bullet and nobody has a dominant success rate.

The most wonderful time in cycles, as in life, is when you find yourself looking to the stars rather than staring at your feet. It's an uplifting feeling when you finally make that transition, as most will atest.

Queen takes Pawn

Sunday, January 5, 2014

Long fun, short asteroids.....

Kids, sometimes it pays to enjoy time.....

Previous posts have already noted what 2014 could look like for stock markets.
Previous posts have looked at Fed changing stance and risk free rate of return. 
Previous posts have also detailed how to stay on a bull market, even though it's nearly impossible to do, I've been thrown off twice and bought back at higher levels!!
This post is more about your state of mind as the world turns.

Over the past few years, you kids have grown and Mum and I have worried endlessly about everything imaginable! Whether that worry was justified ( sometimes it was), or not is a mute point, parents do that. However, this year is different. Why?

Let me list some reasons:
1) stock markets can go up or down, but I'm pretty sure we aren't repeating 2008-2011.
2) watching, researching and trying to predict financial asteroids is time and effort consuming. The world isn't ending.
3) worrying over living isn't an excuse to not look around and enjoy life as it is being led.
4) having fun is so much more important than not!
5) I continue to see great and talented people trying new avenues for business and enjoying the unpredictability of the road they travel.

Asteroid watching and why you don't have to....
1) as long as you understand asteroids exist, you can more often than not discount them.
2) asteroids aren't actually the problem, it's the unseen bumps that cause your balance to be lost.
3) loss of balance feels like a tidal wave
4) tidal waves are not asteroids
5) sometimes there just isn't an issue. Sometimes you made the issue yourself!

Yep, that's right, if you are looking for an issue, you can see something that actually isn't there! Trying to minimize these fears is what will make time so much more productive and fun. Many people throughout history have called for complete disasters that haven't appeared and yet for every 1000 of those predictions, people remember the 1 that actually happened. Even a broken clock is right twice a day...

I've recently been enamored with "experts" arguing amongst themselves about the past. Why has this interested me? Well, that sort of points out that the risks that were so evident in previous years aren't there now or are hidden in a different place where these "experts" aren't looking, hence the arguments over history. 

My telescope is watching the following:
Emerging markets, in particular currencies......not an issue 
Commodity spikes, in particular......not an issue
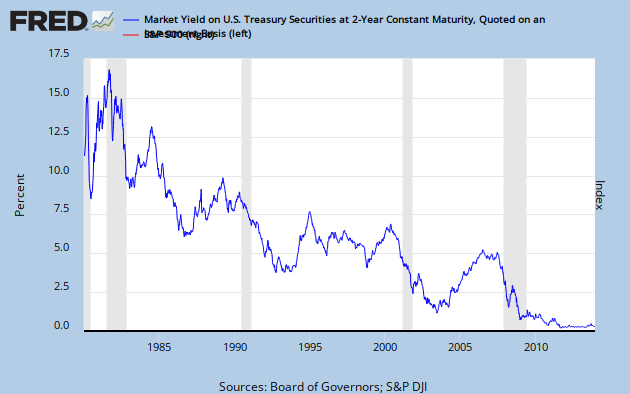
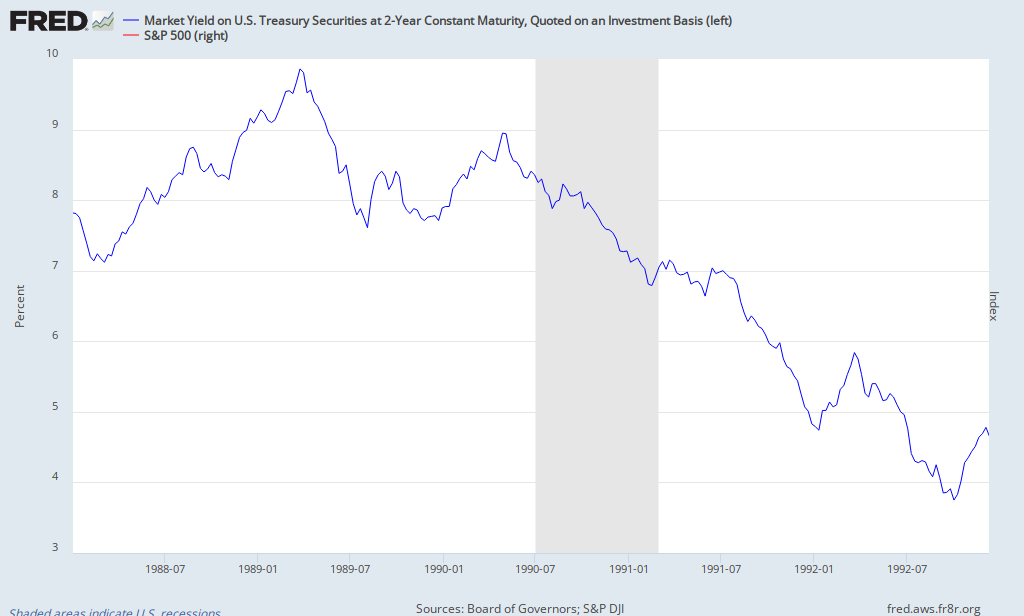
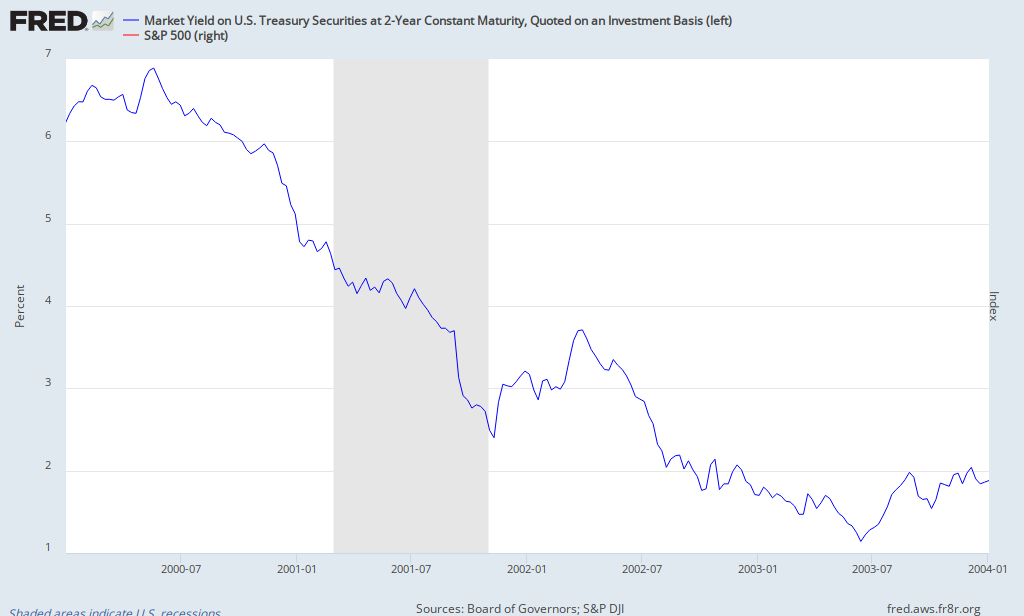
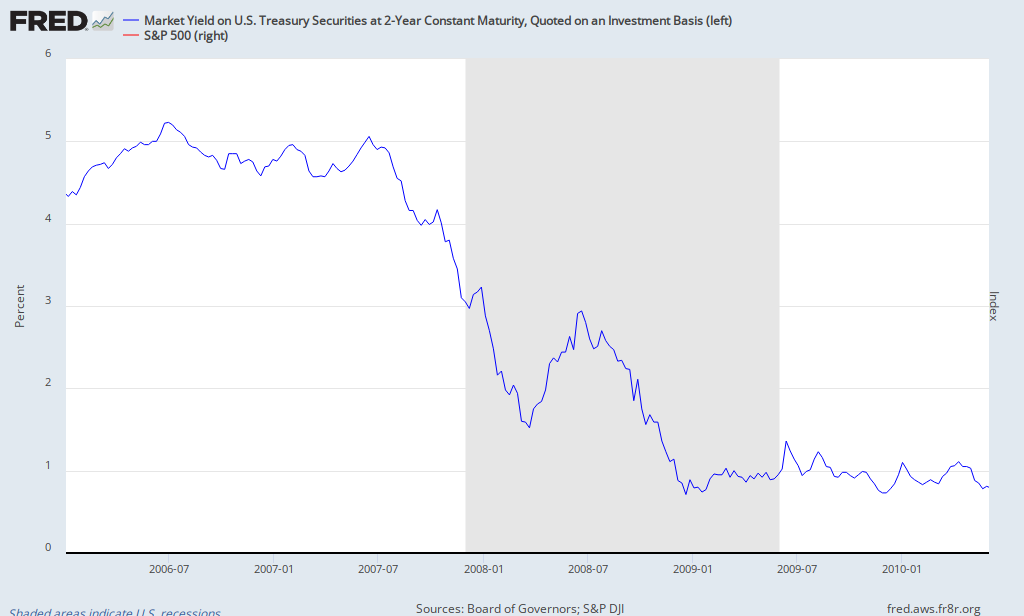
Bond market.....2s anchored, 10s a source of liquidity......not an issue

There is every chance I'm missing something, but from what I can see, read and anticipate, it sure looks like "long fun, short asteroids" is the right stance.

As you continue to put your work in, that work actually becomes easier and less time consuming (think homework!). Now think about the effort to ski, the more effort, the easier! Simples really, but it takes a step back sometimes to smile an recognize the process. Don't underestimate the ability of chaos and the unpredictability of life. As the world turns though there are times to embrace the "here and now", this is one of those times.....

While you are it, give Mum a kiss, she deserves it.

Queen takes pawn


Friday, December 27, 2013

Is the USA the next bubble?

Kids, I'm not sure, but it's possible.....

I've been pondering for some time the extraordinary state we have found ourselves in. Recent history has given us many historic fluctuations in asset prices......

Conglomerates in the 80's.
Internet stocks for Y2K.
Home values in 2006-7.
Leverage funds of recent years.
Gold prices...again.

The commentary from mass media usually encompasses some ridiculous statement about why something has to happen in the future! Well, if you say it enough times, the likelihood is at some point you may stumble upon a correct answer.

We are all aware in 2013 that bond prices likely have downside, but, not because they are a "bubble", it may well be because the USA is on its feet and fighting fit. We have seen precious metals falter since Oct 2011, just when the stock market started to correctly discount bad news for the first time in 3 years. Could the next bubble be us? Could it be that we are living and breathing and benefitting from the previous devastation, a Phoenix from the Ashes?

The US has been in an extraordinary state since 2007, Capex has been limited, cash to buy backs has been up and dividends now make the US look more like the UK than I can ever remember. I am going to assume an awful lot right now, so stick with me....

Let's just say that the we have seen "peak Washington disuption", sensible enough.
Let's also just say that the US has lost none of its entrepreneurship, think FB and TWTR for a minute.
Let's also, also say that Capex is going up, inflation will be in a tight range and the likelihood of the Fed applying the brakes are minimal. 

Corporations two biggest input prices are Employment and Energy prices. Wage inflation is tepid at best, with an escalation being a little positive for inflation. Energy prices are reasonably stable, without a super-spike ala 2008, that doesn't look an issue either. Technology improvements giving productivity gains are just the icing on the cake for me.

What about M&A? Taking some well earned cash and buying some growth seems sensible enough. We have already seen some low hanging fruit being absorbed in 2012 and 2013. Which likely means that at some stage in this cycle someone will reach higher and further, paying higher prices for less of that growth. That doesn't sound at all bad for the right here, right now trade.  

That's an awful lot of assumptions, I know, but.....the potential road we are traveling could well be paved with the most ridiculous upside imaginable

Now, the road isn't without it's bumps and it certainly isn't without consequence, but those are for another time in the future. At this point we are just starting on the path towards those problems and the journey has to travel through some very dynamic and rewarding landscapes before any precipice. We may well be witnessing one of the most extraordinary times for innovation and growth that many of us have rarely witnessed. We really could be looking at a US that can propel itself once more into the forefront of the World. There are obvious risks of over-confidence, political faltering in Foreign policy and basic Washington missteps on taxation, but barring an International quarrel, I have a feeling the next "bubble" may well be an overheating US economy! The most important point to note is that overheating isn't today......

What if we are witnessing a renaissance of historic proportions that give rise to quite wonderous advances (I'm not talking stock prices here either)? Smart, sensible, forward looking individuals that aren't at the whims of very large corporations, that have little of their foresight. For those at the peak of their chosen industries right now, congratulations, but if you do not see potential changes from those around you and act on the potential, your days are likely numbered.

What does it all mean?

Quite frankly, this would point to additional advances in property prices, innovative technology, small and micro-cap still, quality food and premium services. The masses could well be pleased as this tide raises all boats.....

Queen takes Pawn

Monday, December 16, 2013

Can anyone time the top and the bottom of a stock market?

Kids, it's a great question, I'll try to answer....

I'm sure some can, I've yet to see it work over longer periods of times though.

Market tops.

Just when you think the good times can last forever.....

Invariably a topping process can take many many forms. This is mainly due to the players involved. 
For instance, in 1987, the major players used margin to buy stocks in the belief that they could buy at will and sell at a profit without worrying they were on borrowed funds. 
2000 saw a tech spending boom for Y2K, that people extrapolated to last a lifetime, therefore the tech stocks gathered pace and rose only to succumb to lack of future revenues and earnings. 
As for 2007, this was the time of Home leverage! Blame the lenders, blame the borrowers, either way the financial system was leveraged across the board.

Timing the actual top of any of these recent times was almost an impossibility. There were always clues, you just had to know where to find them. One such clue was in a previous post here, the yield curve. The most important clue though was the market itself.

What I look for: outside day reversals in the dominant market. 

An outside day is a higher high and a lower low on price in combination with increased volume. If the market is higher, it's an outside reversal higher. If the market is lower, it's an outside reversal lower. 


SPX 2007 High.


It's not a hard and fast rule, there are times when other considerations need to be taken in consultation. However it's a starting point. 

Market bottoms.

It really is darkest before the dawn.

There have been a couple of times when price action has been so bad, you almost were left laughing at the most extreme points. Consider the process starting at that point for marking a low. In 1987, October and December were awful.

1987 lows


 In 1990 the low was marked by Politicians not being able to prevent Gulf War I.
.

2002 low was the announcement of Afghanistan hostilities. For 2009, the actual price low was marked by an appalling unemployment report! You can see a pattern emerging. 
The price action from stocks was also very telling as at all points, further bad news was discounted and stocks actually rallied as further news was known.

So you see, with the benefit of hindsight and some stock market intelligence, being able to think clearly is of paramount importance.

Major tops and major lows can be seen quite clearly without pinpointing the exact days.

Consecutive down days to time the longs...
When we are in bull market mode, I like to use consecutive down days to guide my buying. There are usually 12-14 sets of 3 consecutive down days in any one year. 4 consecutive down days about 8, 5 days at 4 times. 6 consecutive down days number about 2. Any more than 6 consecutive down days risks a crash. 
In conjunction with these consecutive down days, you need to gauge some panic. I do this via the TICK index for NYSE stocks. The number needs to read -1300 or worse. Don't ask why, it just seems to work. This stacks the cards in your favor for entry levels. I use it frequently, it rarely let's me down. The trick is patience.
                                                   
TICK Index. -1500 is extreme


Important things to keep in mind:
A market can remain oversold for a longer time than you expect.
A market can remain overbought for far longer than you can anticipate.

Many experts try to employ a relative strength index, I've never seen one work well, much like an oversold/overbought condition.

Staying on a bull market...
This may sound ridiculous, but actually riding a bull market, is very difficult. At all points you have the threat of bad news derailing your long positions. When you inevitably sell something, it is no crime to re-enter the very same long at a higher price. That is part of managing your situation.


Trading a bear market....
Needless to say, that is as difficult as anything else, due to he fact they are shorter than bull markets and far more violent. The rallies within bear markets are sharp and fast. Many people have lost just by having to cover short positions in a violent bear market rally, only to see those same positions a day later significantly lower. You have to be consistently correct within a bear market. It's nearly impossible to be that correct for such a long period of time. If you try it, position size is the most important, risk very little capital.

Bull and bear markets do not only exist in equities, you can learn from others markets also, namely commodities (gold from 2001 to 2012) and other national markets outside the US. Being away from that action can teach you just as much, without having to listen to all the local noise (think Greece 2011). 

The stock market is a living and breathing creature, it is a difficult mistress. It neither cars for your intellect nor rewards your indiscretions. It cares not whether you are correct, only that the the stock prices themselves are correct. Keep your ego apart from your decisions, indiscipline will inevitably hurt! Everyday there are tricks to learn and, more importantly, re-learn. People will try and convince you there are trades everyday to take advantage of, this may be true, they just may not suit you and the way you trade. Be patient, then be brave.

Queen takes pawn

Thursday, December 12, 2013

Why does the Yield curve matter?

Kids, you don't know what you don't know, until you know it!

Way back in the early 2000's a colleague pointed out the yield curve to me. What was the yield curve? The difference in yield between 2's and 10yr US Treasury debt. We discussed at length what it meant and how we might be able to use it. 

The Curve.
It is as cyclical as the market itself. Almost rhythmical. It has a habit of defining cycles. 

In essence it's primary use is for lending institutions to build balance sheets easily. Borrow short term money cheaply to lend it for a longer period, capturing the spread between the two yields. Simple enough. Remember the Fed are involved when it comes to a steepening or flattening curve.

Here is the longer term chart of yield curve vs SPX.

FRED Graph


Steepening Vs Flattening Curve

So, as the yield curve steepens, you can bet your bottom dollar that financial institutions are making money. Conversely when the yield curve flattens it's likely that financial institutions are sacrificing some yield for more volume as the economy grows.

The cool part

When the yield curve finally moves from an inverted state and steepens for good, you can count the days to a stock market correction.  

I'll show you......

There are times that the yield curve has been INVERTED. This happens when 10yr yield is lower than 2yr yield, giving a negative carry (not being able to borrow short term at advantageous rates to lend longer term).

There are many and varied explanations as to why this happens, the most important thing to note is you are at the end of a bull market and are about to witness a bear market. The length of that Bear market changes according to circumstance. It's a strange sensation. You can see the yield curve steepen for good in 1990 that coincided with a correction in stocks, and in 2000 and, you guessed it, 2007!

1990
FRED Graph


2000
FRED Graph


2007
FRED Graph


Implications of yield curve.


As you see flattening of the curve, there really isn't a concern as a goldilocks scenario exists in the markets. Once you enter an inverted phase, pressure starts on financial institutions to make money in other ways. They do this by increasing their risk profile for activities. At some point that inevitably comes unstuck. Call it bad financing of S&Ls, Internet incubators, Housing, Subprime!

This is a big red flag, do not attempt to outsmart the market or get caught up with a scenario that you lose because others are placing larger bets, what follows is a little chaos. You can see exactly what happens in 1987-1992, 2000-2002, 2007-2011.
As the yield curve is inverted, markets have a habit of rallying, the usual amount is about 6%. Use this time to build your cash positions, be at peace with your wins and your losses, do not over trade. There is an ill wind on the horizon. Timing this ill wind will be tricky, but there is one move that matters beyond any else.

WHEN THE YIELD CURVE FINALLY STEEPENS FROM AN INVERTED STATE, YOU CAN COUNT THE DAYS TO A CORRECTION.
Playing this on the short side can pay handsome dividends, however you will not sleep well as a bear has claws and all positions are subject to daily fluctuations that will force you out of your trades. You can also just be long cash which is a synthetic short as you expect cheaper prices.

These trends are very large and do not end without an awful lot of hardship and business's failing. 
This is your time to be humble and help those that are less fortunate than you. Many will ask for some help, offer it freely and with good grace. You had the benefit of reading this, they did not. 

Use the time of market uncertainty to assess its pulse. Use the steepening curve to understand that financial institutions will become healthy once more, no matter what the media says. When the market looks like it can't get any worse, likely doesn't! Lows have been marked by the starting of Wars, the inability of Governments to act or an Institution failing. The market will start discounting bad news and rally when everything points otherwise, be aware. This is a necessary healing process. You can benefit in the same way as before, allow the market to guide you on your journey.

Buy innovation, be brave. Some will not work out, keep your losses small, it is the gift of discipline. 
Never be afraid to re-enter the same trade, just understand your entry price. Some of the best companies in the world have suffered some short term setbacks.

Once the curve has steepened and the stock markets rally on bad news, you will notice something phenomenal! You are on the right side of the market and the Fed are helping you! That is a powerful friendship to have. 

Study the charts of leading stocks, they can guide you. No need to be too short term on your thinking, that is for others. Enjoy the peaks and troughs as the world really is a wonderful place. Keep your integrity, honour and discipline, it is yours alone.

Queen takes pawn.