I'm sure some can, I've yet to see it work over longer periods of times though.
SPX 2007 High.


![]()
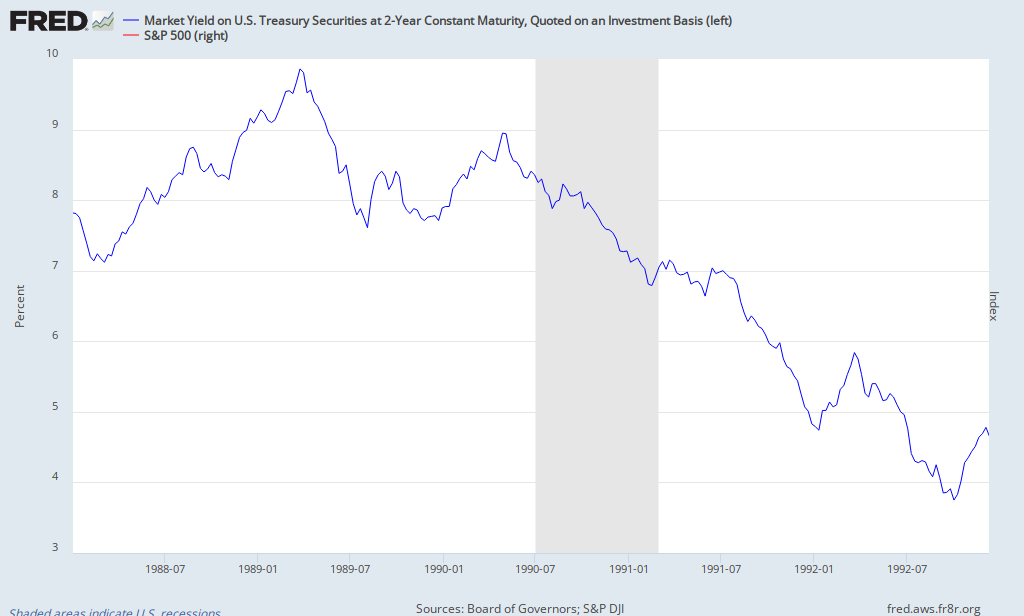
In 1990 the low was marked by Politicians not being able to prevent Gulf War I.
 .
.
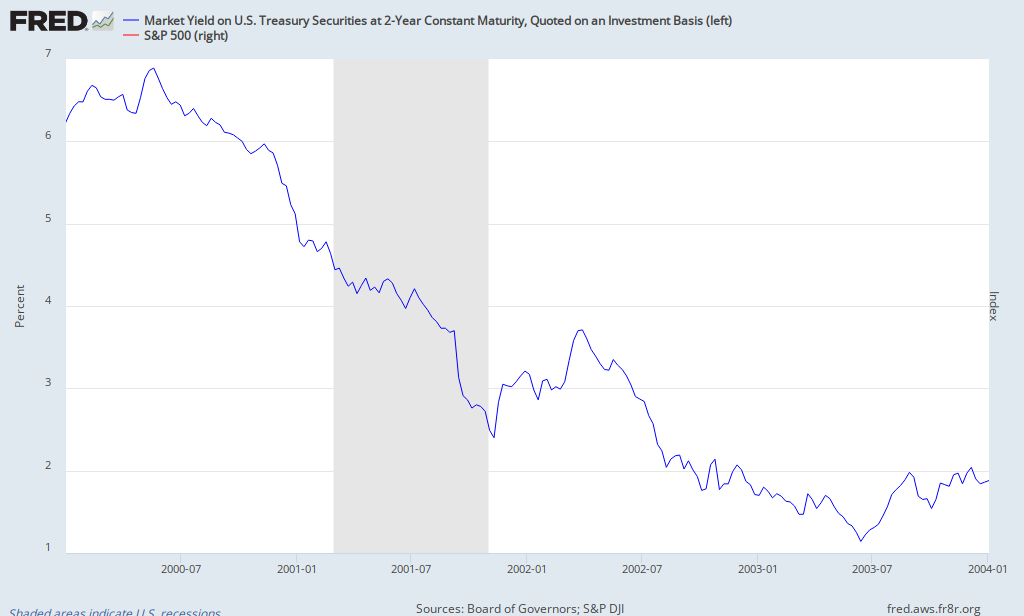
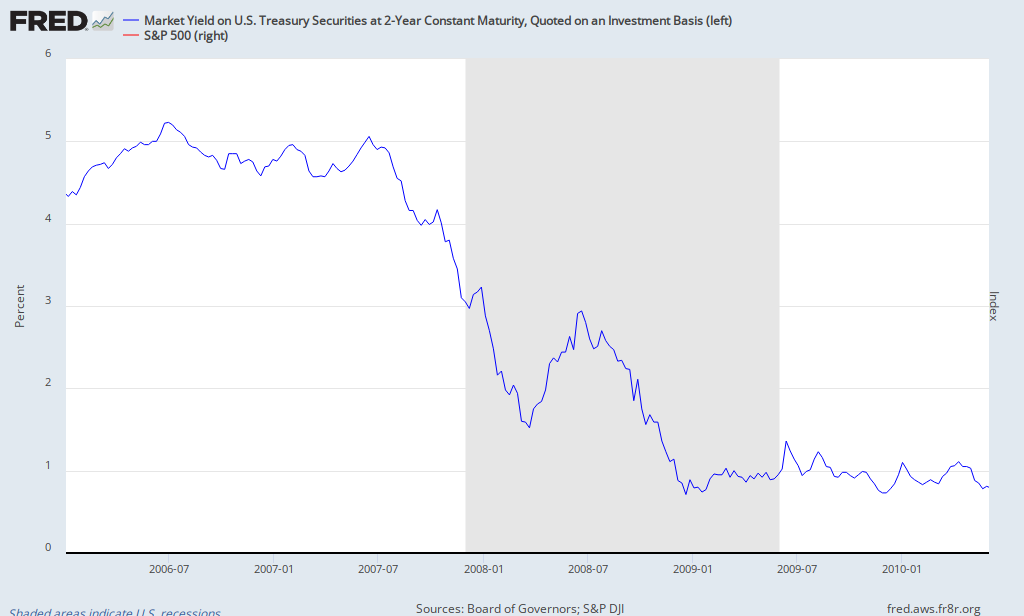
2002 low was the announcement of Afghanistan hostilities. For 2009, the actual price low was marked by an appalling unemployment report! You can see a pattern emerging.
Consecutive down days to time the longs...
Many experts try to employ a relative strength index, I've never seen one work well, much like an oversold/overbought condition.
Trading a bear market....
Market tops.
Just when you think the good times can last forever.....
Just when you think the good times can last forever.....
Invariably a topping process can take many many forms. This is mainly due to the players involved.
For instance, in 1987, the major players used margin to buy stocks in the belief that they could buy at will and sell at a profit without worrying they were on borrowed funds.
2000 saw a tech spending boom for Y2K, that people extrapolated to last a lifetime, therefore the tech stocks gathered pace and rose only to succumb to lack of future revenues and earnings.
As for 2007, this was the time of Home leverage! Blame the lenders, blame the borrowers, either way the financial system was leveraged across the board.
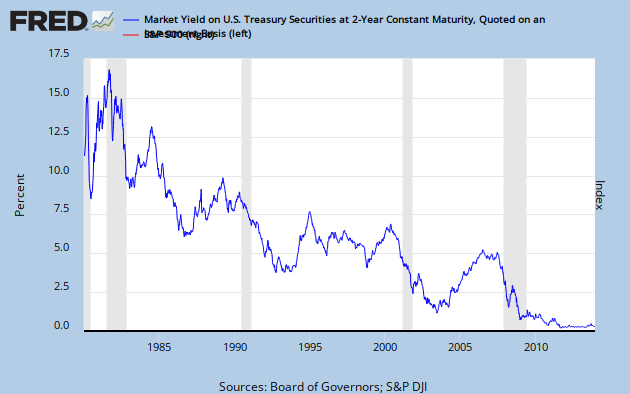
Timing the actual top of any of these recent times was almost an impossibility. There were always clues, you just had to know where to find them. One such clue was in a previous post here, the yield curve. The most important clue though was the market itself.
What I look for: outside day reversals in the dominant market.
An outside day is a higher high and a lower low on price in combination with increased volume. If the market is higher, it's an outside reversal higher. If the market is lower, it's an outside reversal lower.
SPX 2007 High.

It's not a hard and fast rule, there are times when other considerations need to be taken in consultation. However it's a starting point.
Market bottoms.
It really is darkest before the dawn.
There have been a couple of times when price action has been so bad, you almost were left laughing at the most extreme points. Consider the process starting at that point for marking a low. In 1987, October and December were awful.
It really is darkest before the dawn.
There have been a couple of times when price action has been so bad, you almost were left laughing at the most extreme points. Consider the process starting at that point for marking a low. In 1987, October and December were awful.


2002 low was the announcement of Afghanistan hostilities. For 2009, the actual price low was marked by an appalling unemployment report! You can see a pattern emerging.
The price action from stocks was also very telling as at all points, further bad news was discounted and stocks actually rallied as further news was known.
So you see, with the benefit of hindsight and some stock market intelligence, being able to think clearly is of paramount importance.
Major tops and major lows can be seen quite clearly without pinpointing the exact days.
Major tops and major lows can be seen quite clearly without pinpointing the exact days.
Consecutive down days to time the longs...
When we are in bull market mode, I like to use consecutive down days to guide my buying. There are usually 12-14 sets of 3 consecutive down days in any one year. 4 consecutive down days about 8, 5 days at 4 times. 6 consecutive down days number about 2. Any more than 6 consecutive down days risks a crash.
In conjunction with these consecutive down days, you need to gauge some panic. I do this via the TICK index for NYSE stocks. The number needs to read -1300 or worse. Don't ask why, it just seems to work. This stacks the cards in your favor for entry levels. I use it frequently, it rarely let's me down. The trick is patience.
TICK Index. -1500 is extreme

TICK Index. -1500 is extreme

Important things to keep in mind:
A market can remain oversold for a longer time than you expect.
A market can remain overbought for far longer than you can anticipate.
Many experts try to employ a relative strength index, I've never seen one work well, much like an oversold/overbought condition.
Staying on a bull market...
This may sound ridiculous, but actually riding a bull market, is very difficult. At all points you have the threat of bad news derailing your long positions. When you inevitably sell something, it is no crime to re-enter the very same long at a higher price. That is part of managing your situation.
Trading a bear market....
Needless to say, that is as difficult as anything else, due to he fact they are shorter than bull markets and far more violent. The rallies within bear markets are sharp and fast. Many people have lost just by having to cover short positions in a violent bear market rally, only to see those same positions a day later significantly lower. You have to be consistently correct within a bear market. It's nearly impossible to be that correct for such a long period of time. If you try it, position size is the most important, risk very little capital.
Bull and bear markets do not only exist in equities, you can learn from others markets also, namely commodities (gold from 2001 to 2012) and other national markets outside the US. Being away from that action can teach you just as much, without having to listen to all the local noise (think Greece 2011).
The stock market is a living and breathing creature, it is a difficult mistress. It neither cars for your intellect nor rewards your indiscretions. It cares not whether you are correct, only that the the stock prices themselves are correct. Keep your ego apart from your decisions, indiscipline will inevitably hurt! Everyday there are tricks to learn and, more importantly, re-learn. People will try and convince you there are trades everyday to take advantage of, this may be true, they just may not suit you and the way you trade. Be patient, then be brave.
Queen takes pawn